Using Psychometrics to Predict Technical Performance
Predictive Modelling
Executive Summary
A multi-national mining company was supported during a talent measurement process.
A behavioural and technical 360 was used alongside two psychometrics (Habitus & Foresight).
Both Habitus and Foresight showed predictive validity, with respect to 360 performance ratings.
Context
Participants held a variety of team member and team leader professional roles within the same department.
A custom technical 360 was created for each role type, starting with job descriptions and refined through client workshops.
The 360 and psychometrics were completed ahead of two feedback sessions:
Initially with the participant only, to explore the results and understand their career journey, current challenges and future aspirations
Later in the week: the participant and their manager, to return to important points from the first feedback session and then start crafting a development plan
360 Survey
Quality Checks
Data were cleaned by primarily checking:
The free-text comments provided within each 360, to select-out raters and / or participants for reasons such as:
Only recently starting in role
Being incorrectly assigned as a rater
Lack of variation in response patterns, where a rater gave the same response to every question in the 360
This led to four participants being removed from later analyses plus several rater by participant combinations.
360 Structure
The 360 contains two distinct elements:
Technical questions related the specific role each participant was in, which were created through workshops with subject matter experts
Leadership questions related to the three core values of the company’s leadership accountability model, which applied to all roles
The leadership model had a cascading structure, whereby the three core values were made up of several competencies, however the correlation plot below shows that leadership ratings were highly correlated.
Hence a simple overall score was used for both technical and leadership questions. Here the participant’s self-ratings were removed, then all the remaining raters were combined using a mean average.
Findings
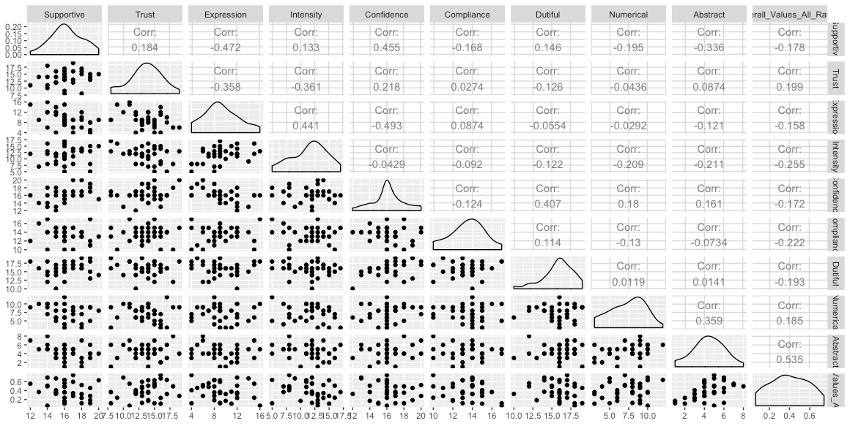
Multiple areas from within both psychometrics showed promising correlations with both 360 outcomes. The graphs below contain three distinct bits of information:
Along the diagonal, there are density plots for each variable
Above the diagonal, there are the Pearson bivariate correlations, where the far right column shows the correlation between Habitus and Foresight scales with an Outcome Measure
Below the diagonal, there are scatterplots between each variable
These plots show promising findings for both assessments, with useful relationships appearing for both outcomes.
Please note: no corrections were applied to either predictors nor outcome measures.
Psychometric Scales showing an association with Behavioural (left) and Technical performance
Whilst this is a small sample, basic linear regression models were built using a subset of the above variables, as crude initial estimate of the psychometrics’ predictive validity in relation to these 360 outcomes.
The plots below illustrate the positive relationship between each model and the respective outcome.
Participant’ performance on each outcome was also broken into approximate quartile groups, to more clearly illustrate how each model was performing.
Model Predictions with Behavioural (left) and Technical performance
Model performance was promising for both outcomes:
Leader’s overall behavioural performance model had an R squared of 0.418 (adjusted 0.361)
Leader’s overall technical performance model had an R squared of 0.505 (adjusted 0.439)
These model performance values are large and show that the psychometrics were able to explain up to 50% of leadership performance.